Binary phase diagrams
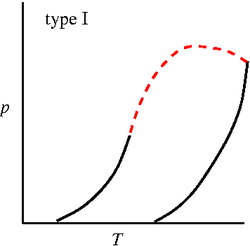
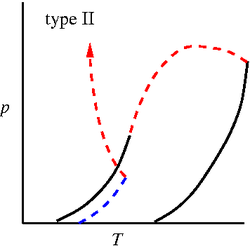
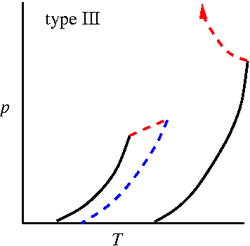
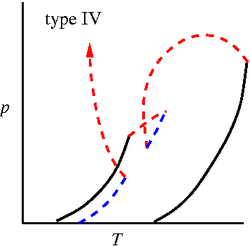
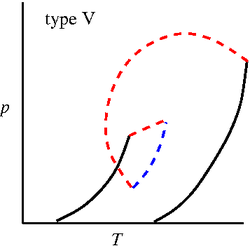
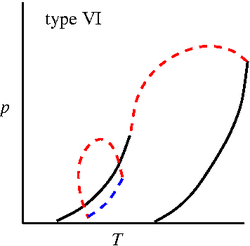
Binary phase diagrams. Studied by J. J. van Laar using the Van der Waals equation of state [1][2][3][4][5]. The six major types of binary mixture phase diagrams (in the pressure-temperature plane) are given by (solid lines: vapour pressure of the two components, dashed lines are three phase lines and dotted lines are critical lines) [6]:
Type I
Type II
Type III
Type IV
Type V
Type VI
References
- ↑ J. J. van Laar "On some phenomena, which can occur in the case of partial miscibility of two liquids one of them being anomalous specially water", Proceedings of the Koninklijke Nederlandse Akademie van Wetenschappen 7 pp. 517-531 (1905)
- ↑ J. J. van Laar "On the different forms and transformations of the boundary curves in the case of partial miscibility of two liquids", Proceedings of the Koninklijke Nederlandse Akademie van Wetenschappen 7 pp. 636-646 (1905)
- ↑ J. J. van Laar "An exact expression for the course of the spinodal curves and their of plaitpoints for all temperatures, in the case of mixture of normal substances", Proceedings of the Koninklijke Nederlandse Akademie van Wetenschappen 7 pp. 646-657 (1905)
- ↑ J. J. van Laar "On the shape of the plaitpoint curves for mixtures of normal substances", Proceedings of the Koninklijke Nederlandse Akademie van Wetenschappen 8 pp. 33-48 (1905)
- ↑ J. J. van Laar "The shape of the spinodal and plaitpoint curves for binary mixtures of normal substances", Proceedings of the Koninklijke Nederlandse Akademie van Wetenschappen 9 pp. 226-235 (1906)
- ↑ Robert L. Scott "Models for phase equilibria in fluid mixtures", Accounts of Chemical Research 20 pp. 97-107 (1987)
- Related reading
