Phase diagrams: Pressure-temperature plane
Jump to navigation
Jump to search
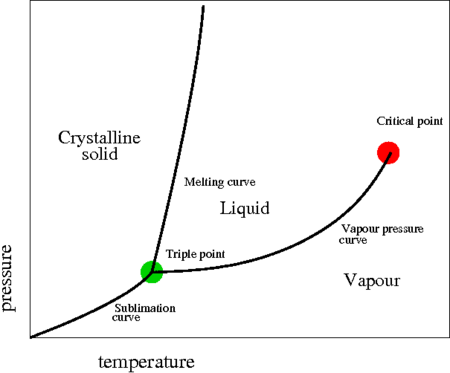
The following is a schematic phase diagram of a monatomic substance in the temperature-pressure plane. It shows the vapour and liquid phases, as well as the crystalline solid phase. The critical point is highlighted by a red spot, and the green spot represents the triple point.
