Phase diagrams: Pressure-temperature plane: Difference between revisions
Jump to navigation
Jump to search
Carl McBride (talk | contribs) No edit summary |
Carl McBride (talk | contribs) No edit summary |
||
| Line 4: | Line 4: | ||
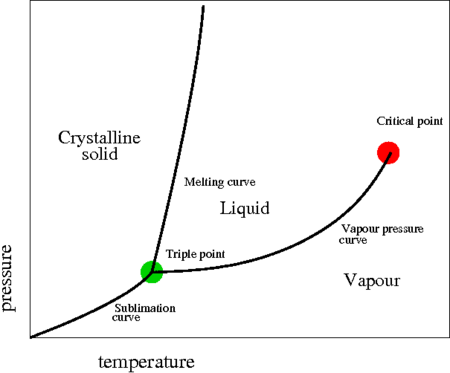
triple point. | triple point. | ||
[[Image:press_temp.png]] | [[Image:press_temp.png|center|450px]] | ||
==See also== | ==See also== | ||
*[[Density-temperature]] | *[[Density-temperature]] | ||
[[category:phase diagrams]] | [[category:phase diagrams]] | ||
