Hertzian sphere model: Difference between revisions
Carl McBride (talk | contribs) (New page: The '''Hertzian sphere model''' is given by <ref>[http://dx.doi.org/10.1063/1.3186742 Josep C. Pàmies, Angelo Cacciuto, and Daan Frenkel "Phase diagram of Hertzian spheres", Journal of Ch...) |
Carl McBride (talk | contribs) m (Added a plot of the Hertzian sphere potential) |
||
| Line 9: | Line 9: | ||
</math> | </math> | ||
where <math> \Phi_{12}\left( r \right) </math> is the [[intermolecular pair potential]], <math>r := |\mathbf{r}_1 - \mathbf{r}_2|</math> is the distance between site 1 and site 2. <math>\sigma</math> represents a length scale and <math>\epsilon</math> an energy. In the limit <math>k_BT/\epsilon \rightarrow 0</math> this potential becomes the [[hard sphere model]]. | where <math> \Phi_{12}\left( r \right) </math> is the [[intermolecular pair potential]], <math>r := |\mathbf{r}_1 - \mathbf{r}_2|</math> is the distance between site 1 and site 2. <math>\sigma</math> represents a length scale and <math>\epsilon</math> an energy. In the limit <math>k_BT/\epsilon \rightarrow 0</math> this potential becomes the [[hard sphere model]]. For example, for <math>\epsilon=10</math> the potential looks like | ||
:[[Image:Hertzian_sphere.png|500px]] | |||
==References== | ==References== | ||
<references/> | <references/> | ||
[[category: models]] | [[category: models]] | ||
Revision as of 15:13, 6 April 2010
The Hertzian sphere model is given by [1] (Eq. 1):
- Failed to parse (SVG (MathML can be enabled via browser plugin): Invalid response ("Math extension cannot connect to Restbase.") from server "https://wikimedia.org/api/rest_v1/":): {\displaystyle \Phi_{12}\left( r \right) = \left\{ \begin{array}{lll} \epsilon (1-r/\sigma)^{5/2} & ; & r < \sigma \\ 0 & ; & r \geq \sigma \end{array} \right. }
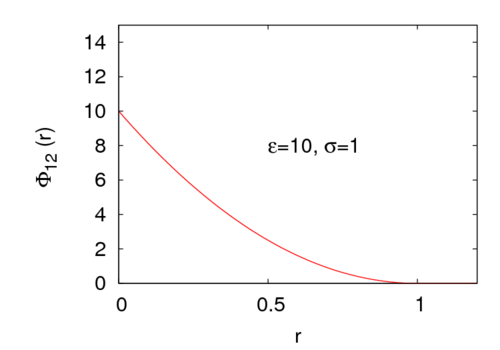
where Failed to parse (SVG (MathML can be enabled via browser plugin): Invalid response ("Math extension cannot connect to Restbase.") from server "https://wikimedia.org/api/rest_v1/":): {\displaystyle \Phi_{12}\left( r \right) } is the intermolecular pair potential, Failed to parse (SVG (MathML can be enabled via browser plugin): Invalid response ("Math extension cannot connect to Restbase.") from server "https://wikimedia.org/api/rest_v1/":): {\displaystyle r := |\mathbf{r}_1 - \mathbf{r}_2|} is the distance between site 1 and site 2. Failed to parse (SVG (MathML can be enabled via browser plugin): Invalid response ("Math extension cannot connect to Restbase.") from server "https://wikimedia.org/api/rest_v1/":): {\displaystyle \sigma} represents a length scale and Failed to parse (SVG (MathML can be enabled via browser plugin): Invalid response ("Math extension cannot connect to Restbase.") from server "https://wikimedia.org/api/rest_v1/":): {\displaystyle \epsilon} an energy. In the limit this potential becomes the hard sphere model. For example, for Failed to parse (SVG (MathML can be enabled via browser plugin): Invalid response ("Math extension cannot connect to Restbase.") from server "https://wikimedia.org/api/rest_v1/":): {\displaystyle \epsilon=10} the potential looks like

