File:SALR.png
No higher resolution available.
SALR.png (800 × 450 pixels, file size: 4 KB, MIME type: image/png)
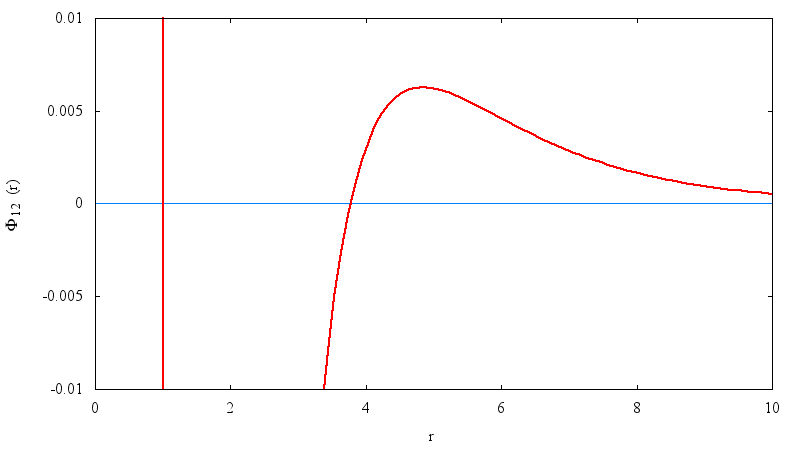
Plot of a region of the HCDY potential for the parameters , , , , as used in the work of Sweatman et. al.


File history
Click on a date/time to view the file as it appeared at that time.
| Date/Time | Thumbnail | Dimensions | User | Comment | |
|---|---|---|---|---|---|
| current | 16:58, 14 March 2018 | | 800 × 450 (4 KB) | Carl McBride (talk | contribs) | Corrected y axis label |
| 16:55, 14 March 2018 | 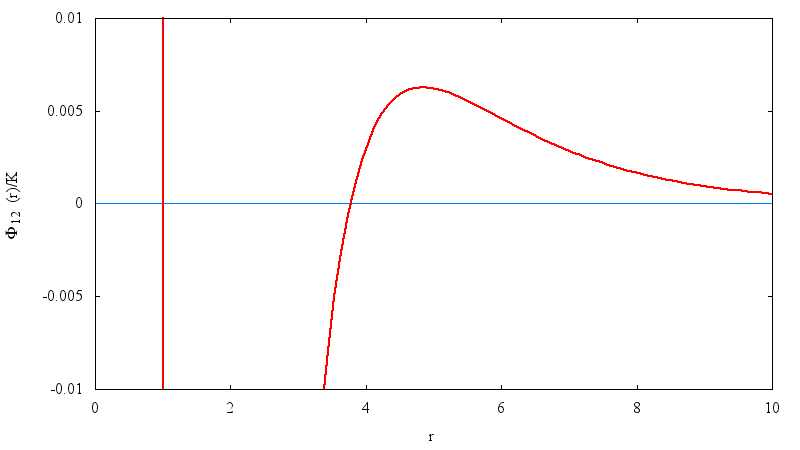 | 800 × 450 (5 KB) | Carl McBride (talk | contribs) | Plot of a region of the HCDY potential for the parameters <math>\epsilon_r=0.5</math>, <math>\kappa_r=0.5</math>, <math>\epsilon_a=2</math>, <math>\kappa_a=1</math>, as used in the work of Sweatman ''et. al.'' |
You cannot overwrite this file.
File usage
The following page uses this file: